
Yokogawa AQ1000 OTDR Optical Time Domain Reflectometer
Yokogawa AQ1000 OTDR Optical Time Domain Reflectometer
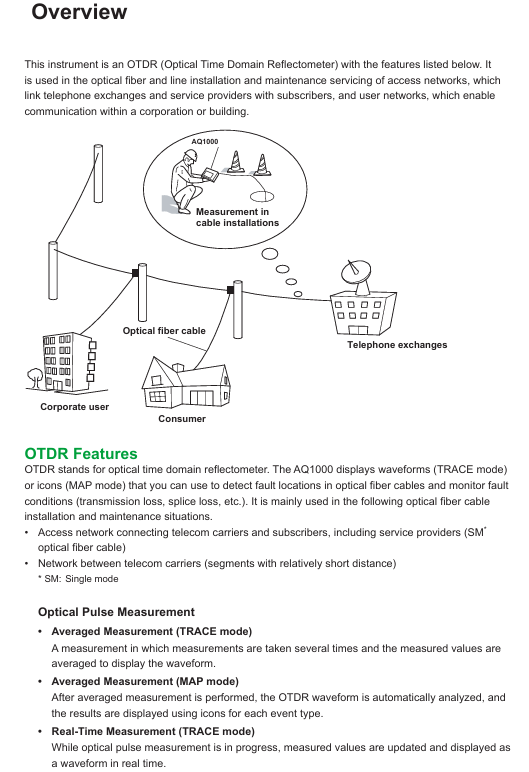
Core functions of the device
As an OTDR device, AQ1000 is primarily used to detect fiber optic fault locations, monitor transmission losses, fusion losses, and other parameters. Its main functions are as follows:
1. Optical pulse measurement function
Support two core measurement modes to meet different scenario requirements:
Average Measurement
TRACE mode: After multiple measurements, take the average of the data and display the results in waveform form to improve the signal-to-noise ratio. It can detect weak events that are masked by noise, such as fusion losses and reflections.
MAP mode: After completing the average measurement, the OTDR waveform is automatically analyzed, and various events (such as fusion points and bending points) are marked with icons. If the qualified/unqualified judgment conditions are preset, the judgment results will be displayed in the color of the icon.
Key feature: Supports one-time measurement of dual wavelengths of 1310nm and 1550nm (multi wavelength measurement). During measurement, the average measurement is completed at 1310nm first, and then automatically switches to 1550nm measurement.
Real time measurement
Only supports TRACE mode, with real-time waveform updates and displays during the measurement process. It can monitor events such as fusion loss and return loss in real time, as well as observe waveform changes when parameters such as wavelength, distance range, and pulse width change.
Limitation: Cannot be performed in MAP mode, it will automatically switch to TRACE mode after starting real-time measurement.
2. Data display and analysis function
The data shows
TRACE mode: The horizontal axis represents distance and the vertical axis represents loss level, displaying the waveform of optical pulse measurement. The waveform can be scaled and moved, and detected losses or reflections (referred to as "events") will be marked on the waveform.
MAP mode: Display all events from the measurement starting point to the fiber optic endpoint in order using icons, label the event type (such as fusion, bending, splitter) and distance from the starting point, and visually present the status of the fiber optic line.
data analysis
Waveform analysis: Measure the distance between two points, fusion loss, and return loss (inter marker return loss) through the cursor and markers.
Event analysis: Automatically detect events and display them on the screen (TRACE mode marked on the waveform, MAP mode displayed with icons), support event editing (insert/delete events, insert/delete distance reference point R), adjustable event detection conditions (such as fusion loss threshold, return loss threshold).
3. Pass/Fail Judgment
Judgment logic: Set a threshold for each measurement item. If the measurement value does not exceed the threshold, the event is judged as "Pass", and if it exceeds the threshold, it is judged as "Fail".
Judgment items: including connector loss, fusion loss, return loss, loss per kilometer between events (dB/km), and total loss.
The results show that in TRACE mode, qualified events have no special markings, while unqualified events are marked in red; In MAP mode, different colored icons are used to distinguish between them. The top progress bar is green when all events are qualified, and red when there are unqualified events.
4. Light source and power detection function
Stable Light Source
Transmit measurement light (continuous CW or modulated CHOP) from the OTDR port, with a wavelength consistent with the OTDR light pulse wavelength (1310nm/1550nm), for measuring optical loss or identifying optical fibers.
Visible light source (/VLS option)
Only supported by VLS option devices, emitting 650nm visible light (CW or 2Hz modulated CHOP) from the VLS port for visual inspection of fiber breakpoints and checking the core of multi-core fibers.
Power checker
Detect the presence of communication light (in use fiber) in the measured optical fiber through the OTDR port and check its power value. The supported wavelengths for measurement include 1310nm, 1490nm, 1550nm, 1625nm, and 1650nm.
5. Data storage and transmission function
File type and purpose
Characteristics of file format usage
. SOR stores the measurement results of optical pulses (including measurement/analysis conditions, waveform data, and event list data), which can display waveforms and event analysis results after loading. It only supports SOR files generated by AQ1000 devices
PDF stores the waveform data of the current screen or saved files in a report format. The report can be customized to include items such as job information, link summaries, and waveform diagrams
CFG storage system settings (devices, connections, etc.) can be used for unified configuration of multiple AQ1000 devices
. BMP/. JPG storage device screen images are only for viewing on a computer and cannot be loaded back into AQ1000
SOZ stores multiple waveforms measured simultaneously and only supports loading with AQ1000. When using AQ7933 OTDR simulation software for PC analysis, it needs to be split into SOR files
storage medium
- OMRON
- ABB
- General Electric
- EMERSON
- Honeywell
- HIMA
- ALSTOM
- Rolls-Royce
- MOTOROLA
- Rockwell
- Siemens
- Woodward
- YOKOGAWA
- FOXBORO
- KOLLMORGEN
- MOOG
- KB
- YAMAHA
- BENDER
- TEKTRONIX
- Westinghouse
- AMAT
- AB
- XYCOM
- Yaskawa
- B&R
- Schneider
- KONGSBERG
- NI
- WATLOW
- ProSoft
- SEW
- ADVANCED
- Reliance
- TRICONEX
- METSO
- MAN
- Advantest
- STUDER
- DANAHER MOTION
- Bently
- Galil
- EATON
- MOLEX
- DEIF
- B&W
- ZYGO
- Aerotech
- DANFOSS
- Beijer
- Moxa
- Rexroth
- Johnson
- WAGO
- TOSHIBA
- BMCM
- SMC
- HITACHI
- HIRSCHMANN
- Application field
- XP POWER
- CTI
- TRICON
- STOBER
- Thinklogical
- Horner Automation
- Meggitt
- Fanuc
- Baldor
- SHINKAWA
- Other Brands
- UniOP
- KUKA
- Iba
- Beckhoff
-
 Basler D90 96801 100 PCB Card
 -
 Basler XR2002F Voltage Regulator (110 VAC, 48-480 Hz)
 -
 Basler SR8A-2B14B3A Regulator
 -
 Basler 9561500100 Module
 -
 Basler DECS-400 BE1-11 System
 -
 Basler DECS-100-B15 Excitation Control
 -
 Basler SCP 210 Frequency Controller
 -
 Basler SR4A-2B15B3A Static Voltage Regulator
 -
 Basler BE1-32R Power Relay
 -
 Basler PIA2400-17GM Power Interface Adapter
 -
 Basler MVC 232 Manual Voltage Control Module
 -
 Basler SSR 32-12 Static Voltage Regulator
 -
 Basler 5MW AVR Generator Voltage Regulator
 -
 Basler VR63-4B Voltage Regulator
 -
 Basler DECS-100-A05 AVR for Engine Generator
 -
 Basler DECS-100-B15 Automatic Voltage Regulator
 -
 Basler BE1-32R Directional Power Relay
 -
 Basler BE1-87B Differential Relay
 -
 Basler UFOV 260A Protective Module
 -
 Basler 9-2614-02-100 PCB Rev M
 -
Basler DECS-100-B15 Digital AVR
-
 Basler 9284900103 PS DECS-400N
 -
 Basler D4N3H1U Intertie Protection
 -
 Basler DECS-100-B15 A15 AVR
 -
 Basler KR4F Voltage Regulator
 -
 Basler BE26434 T14 Transformer
 -
 Basler SR8A-2B15B3A Regulator
 -
 Westinghouse 774B472A12 AR Relay
 -
Basler DECS-100-B15 AVR
-
Basler XR2002F Regulator 110V
-
Basler SR125-E Static Regulator
-
 Basler SSR 125-12 Regulator
 -
 Basler MOC2599 Motor Pot
 -
 Basler BE1-DFPR Feeder Relay
 -
 Basler CBS 305 Current Boost
 -
 Basler BE1-25 AutoSync
 -
 Basler MVC 300 Voltage Control
 -
 Basler BE3-25A AutoSync
 -
 Basler KR7FF Static Regulator
 -
 Basler 90-49000-100 Regulator
 -
 Basler 880 kVA Dry Type Transformer Specs
 -
 Basler Electric BE1-25 Sync-Check Relay Specs
 -
 Basler SSR 125-12 Voltage Regulator Specs
 -
 Basler Electric BE1-851 Overcurrent Relay Review
 -
Basler Electric 149D930G02 Control Sub-Assembly
-
 Basler Electric BE1-81O/UT Frequency Relay Specs
 -
 Basler Electric BE1-51/27C Overcurrent Relay
 -
 Basler Electric 149D956G02 Industrial Component
 -
Basler Electric BE1-51A Overcurrent Relay Specs
-
 Basler Electric BE1-40Q Loss of Excitation Relay
 -
 Basler DECS-200 Excitation Control System
 -
 Basler DECS-200 Voltage Regulator 56-277V AC / 125V DC
 -
Basler BE1-87T Transformer Differential Relay
-
 Basler RDP-110-S1 Protection Relay
 -
 Basler BE1-700V Digital Protective Relay
 -
 Basler BE1-951 Overcurrent Protection System
 -
 Basler DECS-300 Digital Excitation Control
 -
 Basler DECS-200 Digital Excitation Control
 -
 Basler DECS-200-1C Excitation Control System
 -
Basler DECS-200-1L Digital Excitation Control
-
 Basler Electric BE1-GPS Generator Protection System
 -
Basler Electric DECS-200-1C Digital Excitation Controller
-
 Basler Electric DECS125-15 Excitation Control with Power Module
 -
 Basler Electric BE1-87G Differential Relay
 -
 Basler Electric BE1-11 Protection System I5A3M2P2N0EA00
 -
Basler Electric DECS-200-1C Excitation Control System
-
Basler Electric BE1-11g Generator Protection Relay
-
Basler Electric DECS 125-15-B2C1 V2.0.9 Excitation Control
-
 Basler Electric BE1-81O/UT3ED1JA7N2F Frequency Relay
 -
Basler Electric BE1-81O/UT3EE1YB7N1F Frequency Relay
-
 Basler Electric DECS-200-1L Digital Excitation Control System
 -
Basler DECS125-15-B2C1 Excitation Control
-
 Basler 9507900205 SSR Retrofit Voltage Regulator
 -
 Basler BE2000E Digital Voltage Regulator
 -
 Basler BE1-GPS Generator Protection System
 -
Basler DECS-250-CN1CN1N Digital Excitation Control
-
 Basler DGC-2020 Genset Controller
 -
 Basler BE1-81O UT3ED1LA7N0F Frequency Relay (Variant)
 -
 Basler BE1-81O UT3EE1YA9S0F Frequency Relay (Variant)
 -
Basler BE1-81O Over/Under Frequency Relay
-
Basler DECS125-15 Digital Excitation Control
-
Basler Electric BE1-951 Overcurrent Protection System
-
 Basler Electric BE1-700V Digital Protective Relay
 -
 Basler Electric APR63-5 Automatic Voltage Regulator
 -
Basler Electric BE1-851 Overcurrent Protection System
-
Basler Electric DECS-250-LN1SN1N Excitation Control
-
 Basler Electric BE1-87T Transformer Differential Relay
 -
Basler Electric DECS-200-1L Excitation Control System
-
 Basler Electric 9310300100 DECS-300 Excitation Control
 -
 Basler Electric SSE-N 125-4.5KW Shunt Exciter Regulator
 -
 Basler Electric DGC-2020HD-5NS1DNSBA Genset Controller
 -
Basler Electric BE1-81-O/UT3EE1JB7N1F Frequency Relay
-
Basler Electric BE1-81T1EE1WA0N1F Frequency Relay
-
 Basler Electric BE1-25M1EA6PN5R1F Sync-Check Relay
 -
 Basler Electric BE1-GPS Generator Protection System
 -
Basler Electric DECS-250-LN1SN1N Excitation Control Rev V
-
 Basler Electric DECS-250-CN2CN1N Excitation Control
 -
Basler Electric BE1-50/51B-207 Overcurrent Relay
-
Basler Electric DECS-300-C0N0 Excitation Control System
-
Basler Electric DECS-200 Digital Excitation Control System
-
Basler Electric DECS-250-LN1CN1N Excitation Unit
-
Basler Electric DECS-250 LN2SA1D Excitation Unit Specs
-
Basler Electric BE1-87T Transformer Relay Review
-
Basler Electric BE1-11 Protection System
-
Basler Electric BE1-GPS100-E4N1H1N Protection System
-
 Allen-Bradley 442G-MABH-R Safety Module
 -
 Beckhoff CX1030-0111 PLC Assembly Profile
 -
 FANUC IC693CPU364 PLC Module
 -
 Orange Denmark Type 200816 220 PLC Specs
 -
 OMRON C200H-SNT31 Sysmac PLC Module
 -
 Allen Bradley 20AB022A3AYNANC0 PowerFlex 70
 -
 OMRON C200HW-PCU01 Position Control Unit
 -
 ABB AO845A-eA Analog Output Module
 -
 OMRON CJ1M-CPU22 CPU Unit
 -
 Allen Bradley 100-E265ED11 Contactor
 -
 Honeywell 51304511-100 Interface Module
 -
 SOLEXY BXF3S0101N0018 Gateway Module
 -
 OMRON CJ2H-CPU65 CPU Unit
 -
 Automation Direct GS2-45P0 AC Drive
 -
 M68-2000 2-Axis Motion CNC Controller
 -
 OMRON CJ1M-CPU11 V3.0 PLC CPU Unit
 -
 OMRON CJ1W-NC413 4-Axis Positioning Controller
 -
 OMRON 3G2A3-PRO16 Programming Console HMI
 -
 Siemens 3VT8440-2AA04-2GA2 Molded Case Circuit Breaker
 -
 Siemens 3RT5045 Contactor Series
 -
 OMRON C200HS-CPU01-E SYSMAC PLC Controller
 -
 OMRON C500-NC103-E Positioning Control Unit
 -
 OMRON CJ1W-TC001 Temperature Control Unit


