
ZYGO MetroPro 9.0 Reference Guide (OMP-0347M)
Version history: From version 4.0 in 1993 to version 9.0 in 2011, the manual revision records cover functional updates in each version (such as the addition of FDA high-resolution analysis in version 7.10 and optimized pattern editor in version 8.0).
ZYGO MetroPro 9.0 Reference Guide (OMP-0347M)
Software Fundamentals and Core Architecture
1. Basic Information and Document System
Software positioning: Suitable for Zygo precision optical measurement equipment, providing data acquisition, analysis, visualization, and automation functions, supporting custom application configuration to adapt to different measurement scenarios (such as surface morphology, roughness, wavefront analysis).
Version history: From version 4.0 in 1993 to version 9.0 in 2011, the manual revision records cover functional updates in each version (such as the addition of FDA high-resolution analysis in version 7.10 and optimized pattern editor in version 8.0).
2. Software architecture and hierarchical logic
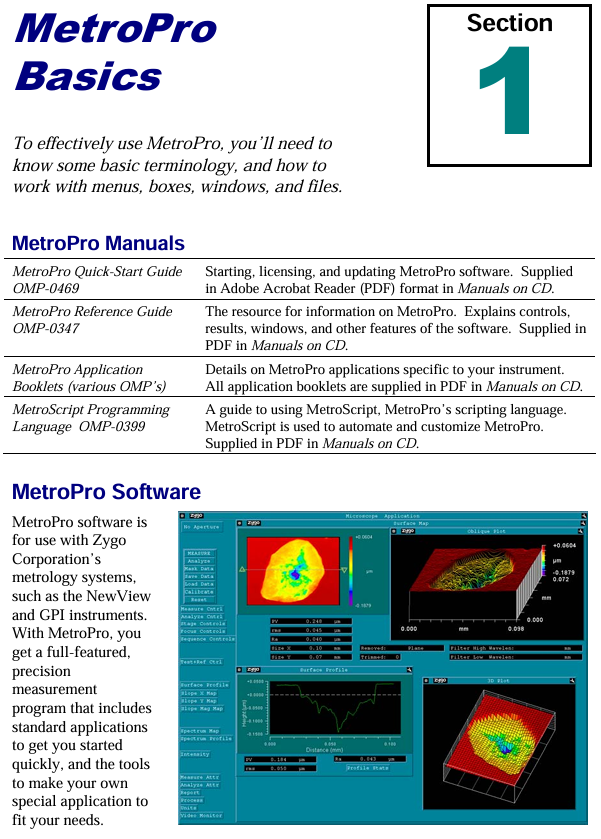
MetroPro adopts a nested window structure, with each component nested in a hierarchical order of "MetroPro main window → application window → function window (control/data/drawing, etc.)". The core components are defined as follows:
Component Type Core Function Example
The top-level interface of MetroPro main window software after startup, which can load/create multiple application windows and display loaded application icons (such as Micro. app)
Application Window is a set of configurations for specific measurement tasks, including sub windows for surface morphology measurement applications such as control and data (including objective control and data display windows)
Control Window manages measurement parameters (such as laser power, scanning mode), triggering operations (measurement/calibration), including the "MEASURE" button and laser intensity control slider
The Data Window displays measurement data, supports plotting (3D/profile), and displays numerical results including filled plots and profile result tables
Plot Window data visualization tools, such as fill plots (surface morphology), profile plots (2D contour), 3D model plots, power spectral density plots (PSD)
Controls/Buttons control parameter adjustment (such as filter type, unit selection), trigger specific function "Auto Focus" button, "Filter Type" dropdown control
3. Basic operating standards
Keyboard and Mouse Operations:
Shortcut keys: F1 triggers measurement, F5 automatically adjusts light intensity, Ctrl+Alt+Delete exits software;
Mouse functions: right-click to bring up menus, middle click to move windows, left click to select/trigger (such as button clicking, text input).
File Management
Supports 10 core file formats, including application configuration (. app), measurement data (. dat), mask (. mas), script (. scr), etc;
File naming convention: The first character is a letter/number, supporting underscores and periods, with a maximum length of 20 characters (after version 7.4). It is recommended to add an extension (such as "Sample01. dat");
Directory operation: Create/switch directories through the "File Handler" dialog box, supporting cross drive file access.
Window Control: Supports window movement, scaling, cascading, and closing (converted to icons), and can be hidden, renamed, deleted, and other operations through the "Window Control" menu.
Detailed explanation of core functional modules
1. Working with Applications
The application is the core task unit of MetroPro, which can be customized to meet different measurement needs. The core operations include:
(1) Application type and loading
Type classification:
Standard application: Pre installed software (such as "Micro. app" for microscopic measurement), write protected, needs to be copied and modified through the user directory;
Custom application: Modify based on existing applications (such as adjusting control positions, adding new drawings) or create from scratch.
Loading process: Right click on the MetroPro main window menu ->"Load Application", select the. app file in the file browser, and support loading multiple applications simultaneously (up to 3 can be opened at the same time).
(2) Application configuration and saving
Core component configuration:
Control window: Add measurement parameter controls (such as objective lens selection, scan length), function buttons (such as "Calibrate" calibration);
Data window: Add plots (such as fill plots, profile plots), result value boxes (such as PV values, RMS values);
Other windows: Report window (generate measurement report), Video monitoring window (real-time display of measurement area).
Save rules:
Save Application ": Specify a name and path when saving for the first time (such as" Customs Surface. app ");
Re save Application ": Overwrite the current application configuration without the need to reselect the path;
Lock application: Press Ctrl+Shift+L to lock the application (to prevent accidental changes), supports password protection (4-13 letters/numbers).
2. Mask Editor
Masks are used to define measurement areas (including/excluding specific areas), supporting 4 types of masks and adapting to different measurement scenarios:
(1) Mask type and function
The core role of mask types in application scenarios
Default (default mask) takes effect by default when no other masks are defined for regular measurements, covering the entire camera field of view
- OMRON
- ABB
- General Electric
- EMERSON
- Honeywell
- HIMA
- ALSTOM
- Rolls-Royce
- MOTOROLA
- Rockwell
- Siemens
- Woodward
- YOKOGAWA
- FOXBORO
- KOLLMORGEN
- MOOG
- KB
- YAMAHA
- BENDER
- TEKTRONIX
- Westinghouse
- AMAT
- AB
- XYCOM
- Yaskawa
- B&R
- Schneider
- KONGSBERG
- NI
- WATLOW
- ProSoft
- SEW
- ADVANCED
- Reliance
- TRICONEX
- METSO
- MAN
- Advantest
- STUDER
- DANAHER MOTION
- Bently
- Galil
- EATON
- MOLEX
- DEIF
- B&W
- ZYGO
- Aerotech
- DANFOSS
- Beijer
- Moxa
- Rexroth
- Johnson
- WAGO
- TOSHIBA
- BMCM
- SMC
- HITACHI
- HIRSCHMANN
- Application field
- XP POWER
- CTI
- TRICON
- STOBER
- Thinklogical
- Horner Automation
- Meggitt
- Fanuc
- Baldor
- SHINKAWA
- Other Brands
- UniOP
- KUKA
- Iba
- Beckhoff
-
 Basler D90 96801 100 PCB Card
 -
 Basler XR2002F Voltage Regulator (110 VAC, 48-480 Hz)
 -
 Basler SR8A-2B14B3A Regulator
 -
 Basler 9561500100 Module
 -
 Basler DECS-400 BE1-11 System
 -
 Basler DECS-100-B15 Excitation Control
 -
 Basler SCP 210 Frequency Controller
 -
 Basler SR4A-2B15B3A Static Voltage Regulator
 -
 Basler BE1-32R Power Relay
 -
 Basler PIA2400-17GM Power Interface Adapter
 -
 Basler MVC 232 Manual Voltage Control Module
 -
 Basler SSR 32-12 Static Voltage Regulator
 -
 Basler 5MW AVR Generator Voltage Regulator
 -
 Basler VR63-4B Voltage Regulator
 -
 Basler DECS-100-A05 AVR for Engine Generator
 -
 Basler DECS-100-B15 Automatic Voltage Regulator
 -
 Basler BE1-32R Directional Power Relay
 -
 Basler BE1-87B Differential Relay
 -
 Basler UFOV 260A Protective Module
 -
 Basler 9-2614-02-100 PCB Rev M
 -
Basler DECS-100-B15 Digital AVR
-
 Basler 9284900103 PS DECS-400N
 -
 Basler D4N3H1U Intertie Protection
 -
 Basler DECS-100-B15 A15 AVR
 -
 Basler KR4F Voltage Regulator
 -
 Basler BE26434 T14 Transformer
 -
 Basler SR8A-2B15B3A Regulator
 -
 Westinghouse 774B472A12 AR Relay
 -
Basler DECS-100-B15 AVR
-
Basler XR2002F Regulator 110V
-
Basler SR125-E Static Regulator
-
 Basler SSR 125-12 Regulator
 -
 Basler MOC2599 Motor Pot
 -
 Basler BE1-DFPR Feeder Relay
 -
 Basler CBS 305 Current Boost
 -
 Basler BE1-25 AutoSync
 -
 Basler MVC 300 Voltage Control
 -
 Basler BE3-25A AutoSync
 -
 Basler KR7FF Static Regulator
 -
 Basler 90-49000-100 Regulator
 -
 Basler 880 kVA Dry Type Transformer Specs
 -
 Basler Electric BE1-25 Sync-Check Relay Specs
 -
 Basler SSR 125-12 Voltage Regulator Specs
 -
 Basler Electric BE1-851 Overcurrent Relay Review
 -
Basler Electric 149D930G02 Control Sub-Assembly
-
 Basler Electric BE1-81O/UT Frequency Relay Specs
 -
 Basler Electric BE1-51/27C Overcurrent Relay
 -
 Basler Electric 149D956G02 Industrial Component
 -
Basler Electric BE1-51A Overcurrent Relay Specs
-
 Basler Electric BE1-40Q Loss of Excitation Relay
 -
 Basler DECS-200 Excitation Control System
 -
 Basler DECS-200 Voltage Regulator 56-277V AC / 125V DC
 -
Basler BE1-87T Transformer Differential Relay
-
 Basler RDP-110-S1 Protection Relay
 -
 Basler BE1-700V Digital Protective Relay
 -
 Basler BE1-951 Overcurrent Protection System
 -
 Basler DECS-300 Digital Excitation Control
 -
 Basler DECS-200 Digital Excitation Control
 -
 Basler DECS-200-1C Excitation Control System
 -
Basler DECS-200-1L Digital Excitation Control
-
 Basler Electric BE1-GPS Generator Protection System
 -
Basler Electric DECS-200-1C Digital Excitation Controller
-
 Basler Electric DECS125-15 Excitation Control with Power Module
 -
 Basler Electric BE1-87G Differential Relay
 -
 Basler Electric BE1-11 Protection System I5A3M2P2N0EA00
 -
Basler Electric DECS-200-1C Excitation Control System
-
Basler Electric BE1-11g Generator Protection Relay
-
Basler Electric DECS 125-15-B2C1 V2.0.9 Excitation Control
-
 Basler Electric BE1-81O/UT3ED1JA7N2F Frequency Relay
 -
Basler Electric BE1-81O/UT3EE1YB7N1F Frequency Relay
-
 Basler Electric DECS-200-1L Digital Excitation Control System
 -
Basler DECS125-15-B2C1 Excitation Control
-
 Basler 9507900205 SSR Retrofit Voltage Regulator
 -
 Basler BE2000E Digital Voltage Regulator
 -
 Basler BE1-GPS Generator Protection System
 -
Basler DECS-250-CN1CN1N Digital Excitation Control
-
 Basler DGC-2020 Genset Controller
 -
 Basler BE1-81O UT3ED1LA7N0F Frequency Relay (Variant)
 -
 Basler BE1-81O UT3EE1YA9S0F Frequency Relay (Variant)
 -
Basler BE1-81O Over/Under Frequency Relay
-
Basler DECS125-15 Digital Excitation Control
-
Basler Electric BE1-951 Overcurrent Protection System
-
 Basler Electric BE1-700V Digital Protective Relay
 -
 Basler Electric APR63-5 Automatic Voltage Regulator
 -
Basler Electric BE1-851 Overcurrent Protection System
-
Basler Electric DECS-250-LN1SN1N Excitation Control
-
 Basler Electric BE1-87T Transformer Differential Relay
 -
Basler Electric DECS-200-1L Excitation Control System
-
 Basler Electric 9310300100 DECS-300 Excitation Control
 -
 Basler Electric SSE-N 125-4.5KW Shunt Exciter Regulator
 -
 Basler Electric DGC-2020HD-5NS1DNSBA Genset Controller
 -
Basler Electric BE1-81-O/UT3EE1JB7N1F Frequency Relay
-
Basler Electric BE1-81T1EE1WA0N1F Frequency Relay
-
 Basler Electric BE1-25M1EA6PN5R1F Sync-Check Relay
 -
 Basler Electric BE1-GPS Generator Protection System
 -
Basler Electric DECS-250-LN1SN1N Excitation Control Rev V
-
 Basler Electric DECS-250-CN2CN1N Excitation Control
 -
Basler Electric BE1-50/51B-207 Overcurrent Relay
-
Basler Electric DECS-300-C0N0 Excitation Control System
-
Basler Electric DECS-200 Digital Excitation Control System
-
Basler Electric DECS-250-LN1CN1N Excitation Unit
-
Basler Electric DECS-250 LN2SA1D Excitation Unit Specs
-
Basler Electric BE1-87T Transformer Relay Review
-
Basler Electric BE1-11 Protection System
-
Basler Electric BE1-GPS100-E4N1H1N Protection System
-
 Allen-Bradley 442G-MABH-R Safety Module
 -
 Beckhoff CX1030-0111 PLC Assembly Profile
 -
 FANUC IC693CPU364 PLC Module
 -
 Orange Denmark Type 200816 220 PLC Specs
 -
 OMRON C200H-SNT31 Sysmac PLC Module
 -
 Allen Bradley 20AB022A3AYNANC0 PowerFlex 70
 -
 OMRON C200HW-PCU01 Position Control Unit
 -
 ABB AO845A-eA Analog Output Module
 -
 OMRON CJ1M-CPU22 CPU Unit
 -
 Allen Bradley 100-E265ED11 Contactor
 -
 Honeywell 51304511-100 Interface Module
 -
 SOLEXY BXF3S0101N0018 Gateway Module
 -
 OMRON CJ2H-CPU65 CPU Unit
 -
 Automation Direct GS2-45P0 AC Drive
 -
 M68-2000 2-Axis Motion CNC Controller
 -
 OMRON CJ1M-CPU11 V3.0 PLC CPU Unit
 -
 OMRON CJ1W-NC413 4-Axis Positioning Controller
 -
 OMRON 3G2A3-PRO16 Programming Console HMI
 -
 Siemens 3VT8440-2AA04-2GA2 Molded Case Circuit Breaker
 -
 Siemens 3RT5045 Contactor Series
 -
 OMRON C200HS-CPU01-E SYSMAC PLC Controller
 -
 OMRON C500-NC103-E Positioning Control Unit
 -
 OMRON CJ1W-TC001 Temperature Control Unit


