The trade pattern is reconstructed, and the natural gas price center is rising
1. The global natural gas trade is active, and China continues to promote the development of the industry
The distribution of global natural gas reserves is relatively concentrated, and the Middle East and the CIS countries account for relatively large reserves. From a global perspective, the proven reserves of global natural gas in 2020 will be 188.1 trillion cubic meters, mainly distributed in the Middle East, CIS countries, the Asia-Pacific region, North America and Africa, accounting for 40.3%, 30.1%, 8.8%, 8.1% and 6.9%, respectively, with Central and South America and Europe accounting for relatively small natural gas reserves. They accounted for 4.2% and 1.7% respectively. From the perspective of national production, in 2021, the United States natural gas production ranks first in the world, accounting for 23.1%, Russia ranked second, accounting for 17.4%, Iran, China and Qatar followed, accounting for 6.4%, 5.2% and 4.4%, the five countries accounted for about 56.4%, the global gas supply is more concentrated.
North America and Asia Pacific have a large consumption of natural gas, and the uneven distribution of production and sales has contributed to the active global natural gas trade. In terms of regional consumption, North America and Asia Pacific have the largest consumption, and the natural gas consumption in North America and Asia Pacific in 2021 will be 1034.11 billion cubic meters and 91.83 billion cubic meters, respectively, accounting for 25.6% and 22.7% of the total global consumption. The consumption of the Commonwealth of Independent States and the Middle East region was 61.083 billion cubic meters and 57.543 billion cubic meters, respectively, accounting for 15.1% and 14.3% of the global total consumption. Due to the geographical mismatch of global natural gas supply and demand, global natural gas trade continues to be active.
The main global natural gas trading regions are North America, Europe and Asia Pacific. The Americas mainly receive natural gas transported by pipeline, and export a lot of LNG (liquefied natural gas); East Asia receives pipeline natural gas and LNG, mainly LNG; Europe is the world's second largest natural gas importer, almost no exports, mainly from Russia, the Middle East and other neighboring regions imported pipeline gas, and imported some LNG from around the world.

Pipeline natural gas can be large-scale gas transmission, LNG auxiliary peak balancing. LNG is the natural gas to remove impurities after cooling to -162°C to make it into a liquid, liquefied LNG volume can be reduced by 600 times, liquid, LNG will not burn, enhance the safety of transportation and storage. At the consumption terminal, LNG is gasified into a gas. In terms of transportation, LNG is mostly transported by gas ship and gas truck, and pipeline gas is transported by pipe network, which is limited by the construction conditions of pipe network. Therefore, pipeline gas plays the role of large-scale transportation, and LNG can solve the problem of peak regulation. In terms of cost, LNG, LNG gasification station needs to be built in the early stage, generally speaking, the total cost of LNG before reaching the consumption network is about 4-5 US dollars/million British thermal units. In terms of pipeline gas, the laying cost of large-caliber natural gas onshore pipelines is about 3.5 million US dollars/km, and the laying cost of submarine pipelines is about 10 million US dollars
1.1.LNG: Global trade is active, and China is the largest importer
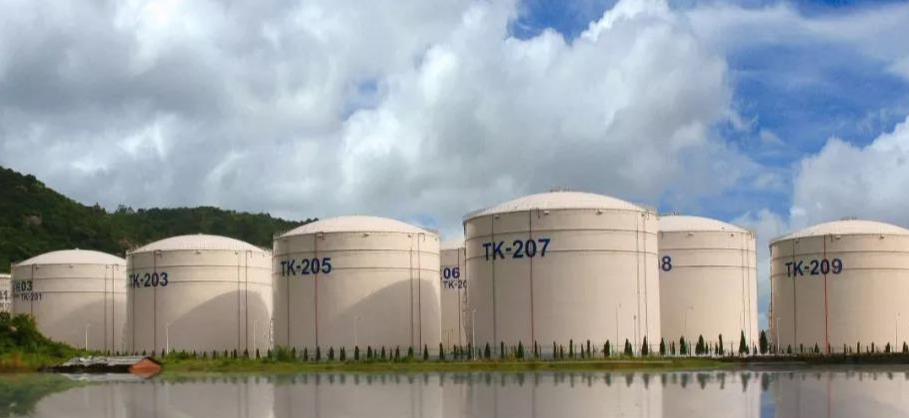
LNG carriers and receiving stations play an important role in the industry chain. From the perspective of the LNG industry chain, in the upstream, after the exploration and exploitation of natural gas, it needs to go through purification, liquefaction and other processes. The midstream link includes storage, loading, transportation, and storage at the receiving station. In the storage process, the required equipment is a thermal storage tank and the air pressure is close to atmospheric pressure. In terms of transportation, transportation vehicles include LNG carriers and tank trucks, and the natural gas evaporating during transportation can be used as fuel for the ship. The receiving station is required to provide storage tanks and regasification units, after which the LNG is regasified and transported to the user terminal through the transmission pipe.
Global LNG trade volume is on a rapid upward trend, and trade is active. Natural gas has significant advantages as a clean energy attribute. As the demand for natural gas continues to increase, the trade volume of natural gas has increased significantly. In terms of LNG, according to Statista data, the global LNG trade volume in 2021 was 51.6 billion cubic meters, an increase of 5.31%, and the global LNG trade volume from 2000 to 2021 increased from 137 billion cubic meters to 516 billion cubic meters, with a CAGR of about 6.52%.
Global LNG capacity is increasing at a high speed. According to Clarkson data, the total capacity of the global LNG Marine fleet in 2021 will reach 505 million tons deadweight. In 2021, the global LNG fleet will reach 700, an increase of 9.03%. From 2010 to 2021, the global LNG fleet will grow from 360 to 700 at a CAGR of 6.88%. With the continuous increase of LNG demand and the continuous development of global LNG trade, LNG shipping capacity has shown a rapid increase trend.
China, Japan and South Korea will import more LNG in 2021. According to Statista data, in 2021, China's LNG import total of 10.95 billion cubic meters, the world's largest LNG importer, import market share accounted for 21.3%; Japan ranked second with 10.13 billion cubic meters of imports, accounting for about 20%, and South Korea's LNG import market share in 2021 accounted for 6.41 billion cubic meters of total imports, accounting for 12.6% of market imports. China, Japan and South Korea are the top three countries in the global LNG import market share, accounting for 53.9% in total, and are the most important LNG importing countries, with a significant difference in LNG imports from other countries.
Japan's LNG tank capacity ranks first in the world. From the perspective of national storage tanks, Japan's LNG storage tank capacity ranks first in the world, with 182 million cubic meters. China's storage tank capacity ranks second, reaching 13 million cubic meters. South Korea's capacity is second only to China's, at 12.26 million cubic meters. Japan, China and South Korea have significantly higher tank capacity than other countries, and the gap is significant. The storage tank capacity of Spain, India, the United Kingdom and the United States is 0.33 million cubic meters, 0.27 million cubic meters, 0.21 million cubic meters and 0.2 million cubic meters, respectively.
China's LNG imports have maintained a rapid growth, and the import sources are mainly LNG exporters. According to Statista data, China's total LNG imports continued to grow from 2014 to 2021, and China's LNG imports in 2021 were 716 million metric tons, an increase of 6.63%. From the perspective of import routes, imports from Australia, the United States and Qatar account for a relatively high proportion, accounting for 39.90%, 11.30% and 10.90% respectively in 2021.

China has accelerated the construction of LNG receiving stations, and its receiving capacity has continued to improve. As of 2021, China has put into operation of LNG receiving stations have reached 22, according to SiaEnergy statistics, as of the first half of 2021, China's LNG receiving capacity reached 88.8 million tons/year, an increase of 25%. The rapid development of LNG receiving stations in China has effectively filled the supply gap of natural gas and played an important role in coordinating the supply of natural gas throughout the country. In 2021, China will receive imports of LNG78.93 million tons, and imported LNG is an important part of China's natural gas consumption.
1.2. Pipeline gas: By the end of 2020, the scale of China's pipeline network project ranks first in the world
By the end of 2020, the Asia-Pacific planned pipeline network construction project ranks first in the world. From the perspective of pipeline networks under construction, by the end of 2020, the total mileage under construction in the world is 54,573 kilometers. The network mileage under construction in the Asia-Pacific region is 27,669 kilometers, ranking first in the world, accounting for 50.7% of the total network mileage under construction in the world. In addition, Europe and Latin America ranked second and third, with 5,911 km and 5,479 km under construction. From the perspective of planned construction pipeline network, the mileage of pipeline network to be built in the Asia-Pacific region is 45,925 kilometers, accounting for 38.0% of the global total pipeline network to be built, and the number of pipeline networks to be built ranks first in the world. In addition to Asia Pacific, the number of pipeline network miles to be built in Africa is higher, reaching 20,446 kilometers.
By the end of 2020, China's planned expansion mileage of natural gas pipelines and the mileage under construction both ranked first in the world. In terms of countries, China plans to build 14,466 kilometers of pipeline length and 15,001 kilometers of pipeline length under construction, ranking first in the world, with a total pipeline mileage of 29,467 kilometers to be built and under construction. India, Russia, the United States and Australia have a total pipeline mileage of 20,440 km, 17,053 km, 11,001 km and 8,537 km respectively.
The largest source of imported pipeline gas is Turkmenistan. According to Wind data, China's pipeline natural gas imports in 2021 will be 53.24 billion cubic meters, an increase of 18.13%. From the perspective of import routes, in 2021, China will import 24 million tons of natural gas from Turkmenistan, accounting for 56% of the total import volume of pipeline natural gas, in addition to Turkmenistan, the other major importers are Russia, Kazakhstan and Uzbekistan, accounting for 18%, 11% and 8% respectively.
Domestic natural gas pipeline "a national network" has been basically formed. From the perspective of the development and construction of China's natural gas industry, in 1963, China's first gas pipeline, namely Bayu gas pipeline, was completed. Since then, regional gas transmission networks have been formed in Sichuan, Daqing and other places. In 2005, the construction of natural gas infrastructure entered a period of rapid development, and major national projects such as large-caliber and long-distance West-east gas pipeline, Shaanxi-Beijing natural gas Pipeline, and Sichuan-East gas pipeline were completed. From 2018 to 2020, China will focus on trunk pipeline interconnection, opening up key areas such as Tianjin, Guangdong, Guangxi and Zhejiang, and solving the problem of uneven gas demand across China. At the same time, it accelerated the construction of natural gas import channels, and promoted the construction of Central Asia, China-Myanmar, China-Russia Eastern route natural gas pipelines, as well as LNG receiving stations in coastal areas of Guangdong, Jiangsu, Shandong and other supporting gas pipelines. At this point, China's northeast, northwest, southwest and offshore four major imported natural gas pipelines have all been connected, and an interconnected, flexible and safe natural gas pipeline network transportation system has initially taken shape.

The length of urban natural gas pipelines in our country is growing rapidly with a steady growth trend. In 2020, the length of China's natural gas urban pipelines will be 850,600 kilometers, an increase of 10.76%. From 2010 to 2020, the length of China's natural gas urban pipelines increased from 256,400 kilometers to 594,100 kilometers to 850,600 kilometers, an increase of more than twice, and the year-on-year growth rate in the decade was more than 10%, and the growth trend was stable. With the popularization of natural gas use in China and the advancement of pipeline projects, the length of natural gas pipelines in Chinese cities continues to increase.
Four major pipelines support China's natural gas imports. China's four major domestic and foreign natural gas pipelines are China-Central Asia Natural Gas Pipeline A/B/C line, China-Central Asia Natural Gas Pipeline D line, China-Myanmar natural gas pipeline and China-Russia East Route natural gas pipeline. Among them, the China-Central Asia A/B/C Line and the China-Myanmar natural gas pipeline have been put into operation, with a total designed transmission capacity of 67 billion cubic meters/year, the China-Russia Eastern Route natural gas pipeline has been put into operation, and the China-Central Asia natural gas Pipeline Line D is under construction, with a designed pipeline transmission capacity of 38 billion cubic meters/year and 30 billion cubic meters/year, respectively. China's four major natural gas import and export pipelines connect Russia, Kazakhstan, Myanmar and Kyaukpyu Port, it is expected that after the completion of the four pipelines, the maximum annual gas transmission capacity will reach 135 billion cubic meters/year, and the pipeline transportation capacity will continue to improve.
2. Tight supply due to the conflict between Russia and Ukraine may continue to support high gas prices
2.1. Europe is highly dependent on natural gas imports, with half of its pipeline gas coming from Russia
Pipeline gas imports are the largest source of natural gas in Europe, and self-produced gas ranks second, with imported LNG playing a complementary role. From the perspective of Europe's natural gas supply pattern, the main supply side includes self-produced, imported LNG, and imported pipeline gas. According to BP data, pipeline gas imports (outside Europe) will be the largest source of gas in Europe in 2021, contributing 232.7 billion cubic meters of gas volume, accounting for 42% of total gas supply. The volume of self-produced natural gas and imported LNG was 210.5 billion cubic meters and 107.2 billion cubic meters, accounting for 38% and 19% respectively.
2.1.1. Self-production: The North Sea gas field has limited resources, and Norway is the main self-producing country
Europe's natural gas reserves are relatively scarce and its resources are limited. Europe has one of the lowest proven reserves of natural gas in the world. According to BP Energy Yearbook data, as of the end of 2020, Europe's proven natural gas reserves of 3.2 trillion cubic meters, accounting for only 1.7% of the global total. In 2020, Europe's reserves/production ratio is only 14.5, far lower than the global average of 48.8, and Europe's natural gas reserves are relatively scarce, the potential for capacity increase is weak, and the recoverable life is low.

North Sea gas fields are the main source of natural gas in Europe. North Sea gas fields are the main source of natural gas in Europe. The North Sea is a marginal sea located in the northeast Atlantic Ocean. It contains oil and gas resources under the sea and is shared by five countries: Britain, the Netherlands, Germany, Denmark and Norway. The North Sea gas fields are concentrated in the waters of Norway, the United Kingdom and the Netherlands, including the Groningen gas field.
European natural gas production has declined in recent years, with Norway, the Netherlands and the United Kingdom accounting for 78% of total production. In 2021, European natural gas production was 210.5 billion cubic meters, down 3.79% year-on-year, with a large decline, mainly due to the unconventional shutdown of North Sea gas fields for maintenance. European natural gas production has been on a downward trend since 2011, from 284.8 billion cubic meters in 2010 to 210.5 billion cubic meters in 2021. By region, Norway, the Netherlands and the United Kingdom are the main gas producers in Europe. In 2021, Norway, the Netherlands and the United Kingdom accounted for 54.3%, 8.6% and 15.5% of production, respectively. Norway contributes a large amount of production and keeps the production relatively stable; Dutch production continues to shrink.
2.1.2. Imports: The United States and Qatar are the main importers of LNG, and Russia is the main importer of pipeline gas
Europe's LNG imports mainly come from the United States, Qatar, Russia, Algeria and Nigeria. In terms of LNG imports, according to BP data, Europe's LNG imports in 2021 will be 108.2 billion cubic meters, mainly from the United States, the Middle East, Russia, North Africa and other places. In 2021, the United States will be the largest importer of LNG in Europe, with Europe importing 30.8 billion cubic meters of LNG from the United States, accounting for 28.5% of total imports. In 2021, Europe will import 22.5 billion cubic meters from Qatar, 17.4 billion cubic meters from Russia and 15.4 billion cubic meters from Algeria, accounting for 20.8%, 16.1% and 14.2% of total imports, respectively.
In 2021, Russia will supply 167 billion cubic meters of pipeline gas, accounting for 45% of Europe's pipeline gas imports. In terms of pipeline gas imports, Europe's pipeline gas imports in 2021 will be 369.2 billion cubic meters, mainly from Russia and Europe. In 2021, Europe will import 167 billion cubic meters of pipeline gas from Russia, accounting for 45.2% of total pipeline gas imports. Within Europe, the use of pipeline gas supplies 136.4 billion cubic meters, accounting for 36.9%, of which Norway contributed
- ABB
- General Electric
- EMERSON
- Honeywell
- HIMA
- ALSTOM
- Rolls-Royce
- MOTOROLA
- Rockwell
- Siemens
- Woodward
- YOKOGAWA
- FOXBORO
- KOLLMORGEN
- MOOG
- KB
- YAMAHA
- BENDER
- TEKTRONIX
- Westinghouse
- AMAT
- AB
- XYCOM
- Yaskawa
- B&R
- Schneider
- Kongsberg
- NI
- WATLOW
- ProSoft
- SEW
- ADVANCED
- Reliance
- TRICONEX
- METSO
- MAN
- Advantest
- STUDER
- KONGSBERG
- DANAHER MOTION
- Bently
- Galil
- EATON
- MOLEX
- DEIF
- B&W
- ZYGO
- Aerotech
- DANFOSS
- Beijer
- Moxa
- Rexroth
- Johnson
- WAGO
- TOSHIBA
- BMCM
- SMC
- HITACHI
- HIRSCHMANN
- Application field
- XP POWER
- CTI
- TRICON
- STOBER
- Thinklogical
- Horner Automation
- Meggitt
- Fanuc
- Baldor
- SHINKAWA
- Other Brands


