Global Energy Transitions Stocktake
The latest IEA analysis tracking the global energy transition, covering technology, investment and people-centred progress toward the Paris Agreement
This year marks the finalisation of the first qlobal stocktake of the Pairs Agreement ,which assesses the world’s collective progress against its climate goals. In support of that important effort, the IEA is bringing together all of its latest data and analysis on clean energy transitions in one place, making it freely accessible to citizens, governments, and industry.
Reaching net zero emissions requires a complete transformation of how we power our daily lives and the global economy. The IEA's Net Zero 2050 Scenario lays out a narrow but achievable pathway to net zero emissions in the energy sector by mid-century – a trajectory consistent with limiting global temperature rise to 1.5oC. Following this pathway represents the world’s best chance of avoiding the worst effects ofclimate change , and requires accelerating the shift to non-emitting sources of energy, such as wind and solar; increasing energy efficiency; electrifying transport, industry and buildings; expanding the use of clean hydrogen and other low-emission fuels; and investing in emissions abating technologies, including negative emission technologies.
The IEA’s Global Energy Transitions Stocktake pulls together the latest data and analysis on the global clean energy transition, including energy sector greenhouse gas emissions, technology developments, energy sector financing, energy access and energy employment. Taken together, these indicators allow us to track global progress of the energy transition and provide an accurate and objective picture of where we are now, and the trajectories we are on.
This page, which will be regularly updated in the lead up to the UN's COP28 climate change conference, includes a calendar of all major report launches throughout the year, making it easy to follow the latest updates and find links to IEA’s publications and in-depth analysis. This series culminates in the release of a new Special Report on Climate which will explore viable pathways in the energy sector to 1.5oC.
In a complex global energy market he emergence of a new clean energy economy provides hope for the way forward
Today, the global average surface temperature is already around 1.2 °C above pre‑industrial levels, prompting heatwaves and other extreme weather events, and greenhouse gas emissions have not yet peaked. The energy sector is also the primary cause of the polluted air that more than 90% of the world’s population is forced to breathe, linked to more than 6 million premature deaths a year. Positive trends on improving access to electricity and clean cooking have slowed or even reversed in some countries.
Much additional progress is still required to meet the objectives of the Net Zero Emissions by 2050 (NZE) Scenario which limits global warming to 1.5 °C. Alongside our main scenarios, we explore some key uncertainties that could affect future trends, including structural changes in China’s economy and the pace of global deployment of solar PV.
Current NDCs commit to an 8% decline in CO2 emissions by 2030 in the energy sector
The IEA Climate Pledges Explorer analyses NDCs from more than 190 countries to estimate energy sector CO2 emissions implied by their targets. The database also provides a complete repository of governments’ net zero pledges, including their legal status and target year.
The path to 1.5 ̊ C has narrowed, but clean energy growth is keeping it open
The case for transforming the global energy system in line with the 1.5 ̊C goal has never been stronger, with global CO2 emissions reaching a record 37 Gt in 2022. Already, solar PV installations and electric car sales are growing fast enough to meet the milestones from our 2021 Net Zero by 2050 report. Plus, innovation is providing new tools and lowering their cost.
But delivering net zero emissions will require larger, smarter and repurposed electricity networks; large quantities of low-emissions fuels; more nuclear power; and scaling up near zero emissions materials production. And, as part of an equitable pathway, almost all countries need to bring forward their targeted net zero dates.
By 2035, emissions need to decline by 80% in advanced economies and 60% in emerging market and developing economies compared with 2022 levels.
Momentum around low-emission hydrogen keeps growing, but progress is still hampered by cost challenges and uncertainty around demand
The number of announced projects for low-emission hydrogen production has grown rapidly in the past year, and could push annual production to 38 Mt in 2030 (from less than 1Mt in 2022). More than 40 countries have now enacted hydrogen strategies, further raising ambitions. But scaling up production is now facing headwinds due to cost inflation and delays in the implementation of supporting policies.
Greater efforts are particularly needed to stimulate demand for low-emission hydrogen, which still accounts for less than 1% of global hydrogen production and use, and will need to grow more than 100-fold by 2030 to meet the IEA’s Net Zero Emissions by 2050 Scenario.
Progress on electricity access has remained slow in 2023, hobbled by financial strains
The latest electricity access data confirms that for the first time in decades, the number of people without access to electricity in the world increased in 2022, rising to 760 million people. This setback was largely due to the combined impacts of the energy crisis and Covid-19 pandemic, and was concentrated in sub-Saharan Africa, home to 80% of those without access to electricity today.
Recent IEA data and analysis suggest that in 2023 progress on expanding has access has resumed but is still below pre-pandemic levels, with solar home systems playing a major role. This update comes in parallel with an update to all of IEA's latest data on Sustainable Development Goal 7: ensuring affordable, reliable, sustainable and modern energy to all.
Stronger international cooperation in high emissions sectors crucial to get on track for 1.5C climate goal
In the past year, only modest progress has been made in strengthening international collaboration in the areas where it is most needed. Progress has been made in expanding financial assistance to developing countries in some sectors, and in joint research and development initiatives. But much more progress is needed in aligning policies to create demand for clean technologies, and in establishing dialogue on trade in sectors where this is likely to be critical to the transition. In most sectors, participation in the leading initiatives for practical cooperation still falls short of a majority of the global market. The report argues that greater political commitment is needed to progress from softer forms of collaboration, such as sharing best practice, to harder forms such as alignment of standards and policies, which are more difficult but can yield greater gains in mobilising investment and accelerating deployment.
The clean energy economy is gaining ground, but greater efforts are needed
Rapid progress of key clean energy technologies shows the new energy economy is emerging faster than many think. The IEA’s Tracking Clean Energy Progress finds that solar PV, electric vehicles and lightning are fully on track in 2022 for their 2030 milestones laid out in the IEA’s Net Zero by 2050 Scenario. Progress can be observed across all of the 50-plus clean energy sectors and technologies evaluated, but accelerated policy support and investment are needed to quickly expand momentum across more countries and to all parts of the energy system to move the world closer to net zero emissions by 2050.
Clean energy investment in emerging markets and developing countries needs to grow steeply to reach SDGs and climate goals
Spending on clean energy in emerging market and developing economies outside of China has stagnated in recent years at around USD 250 billion per year. A seven-fold surge in clean energy investment is needed in these countries by 2035 to align with the Paris Agreement and sustainable development goals: less than 2% of the total would be enough to secure universal access to electricity & clean cooking fuels.
Governments have allocated USD 1.34 trillion to clean energy since the pandemic
In addition, policymakers have spent a further USD 900 billion in efforts to protect households and businesses from rising energy bills since autumn 2021. Only about 25% of these short-term affordability measures were targeted toward households most in need of support or businesses most exposed to the effects of high energy prices. Without better targeting, new affordability measures will further contribute to rising levels of government debt.
Clean energy investment reaches record high in 2022
The recovery from the Covid-19 pandemic and the response to the global energy crisis have provided a major boost to global clean energy investment, which rose to more than USD 1.7 trillion in 2022. For every USD 1 spent on fossil fuels, USD 1.7 is now spent on clean energy. Five years ago this ratio was 1:1. Clean energy investment is set to grow further in 2023, with growth driven largely by solar PV and EVs.
Renewable capacity additions grew by 13% in 2022
Renewable energy capacity additions rose by almost 13% to nearly 340 GW in 2022. However, solar PV was the only technology that broke a deployment record last year, with net additions of nearly 220 GW – a 35% increase from 2021. Annual wind capacity additions fell 21% from 2021 to 2022, declining for the second year in a row.
Global additions of hydropower grew, owing to several large projects in Asia, while bioenergy production for power generation also declined due to the phaseout of subsidies in China, the world’s largest market. For geothermal and CSP technologies, global annual market growth remained small but stable.
Public investment in energy-based research and development grew in 2022
Public RD&D spending reaches new high in 2022, led by China. Public RD&D expenditures play a significant role in fostering new clean energy technologies and bringing them to market. Globally, public spending on energy R&D rose by 10% in in 2022, to nearly USD 44 billion, with 80% devoted to clean energy topics. However, estimated growth in China masks sluggishness elsewhere, maintaining China’s status as the largest public spender on energy R&D. While OECD countries saw their total government spending on energy RD&D stagnate in 2022, new policies, notably the United States Inflation Reduction Act, promise increases in the coming years.
Clean energy supply chains expand substantially in 2022
Clean energy technology manufacturing is expanding rapidly, with new capacity additions posting strong year-on-year growth in 2022 for batteries (72%), solar PV (39%), electrolysers (26%) and heat pumps (13%). Wind manufacturing capacity grew much more modestly at around 2%. The announced pipeline of new manufacturing facilities is also growing. If all were to come to fruition, solar PV and battery manufacturing capacity could meet deployment levels needed in 2030 to meet the IEA’s Net Zero Emissions by 2050 scenario. Conversely, existing capacity plus announced projects for wind, electrolysers, and heat pumps remain insufficient. However, all clean energy supply chains remain highly geographically concentrated: with China alone accounting for 40-80% market share across these 5 technologies.
EVs now close to 15% of global car market
Electric car sales exceeded 10 million in 2022, and accounted for close to 15% of the global car market, up from less than 5% just two years earlier. China continues to dominate the market, representing around 60% of all electric cars sold globally, followed by Europe then the United States.
A growing number of EV policies, such as the Inflation Reduction Act and new EU CO2 standards for cars and vans are driving the outlook for EV sales up, EV costs down, and and are leading to substantially less oil demand by the end of this decade. Around 500 models of electric cars were available to consumers in 2022, and supply chains continue to grow, especially for EV battery production, which is now responsible for 60% of global lithium demand, 30% of cobalt and 10% of nickel.
Global heat pump sales continue double-digit growth
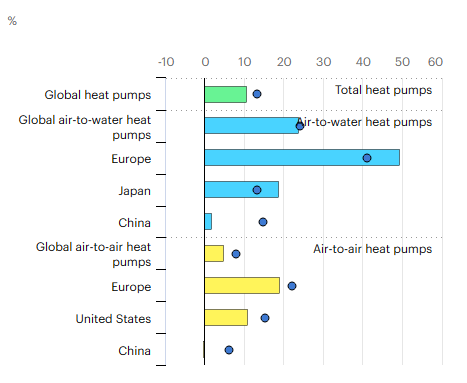
Global sales of heat pumps grew by 11% in 2022, according to the latest IEA analysis, marking a second year of double-digit growth for the central technology in the world’s transition to secure and sustainable heating. Increased policy support and incentives for heat pumps in light of high natural gas prices and efforts to reduce greenhouse gas emissions were key drivers behind the strong uptake. In Europe, heat pumps enjoyed a record year, with sales growing by nearly 40%. In particular, sales of air-to-water models, which are compatible with typical radiators and underfloor heating systems, jumped by almost 50% in Europe. In the United States, heat pump purchases exceeded those of gas furnaces, while in China, the world’s largest heat pump market, sales remained stable.
CO2 Emissions in 2022: Growth in emissions lower than feared
In a year marked by energy price shocks, rising inflation, and disruptions to traditional fuel trade flows, global growth in emissions was lower than feared, despite gas-to-coal switching in many countries. Increased deployment of clean energy technologies such as renewables, electric vehicles, and heat pumps helped prevent an additional 550 Mt in CO2 emissions.
Methane emissions remained stubbornly high in 2022
Methane is responsible for around 30% of the rise in global temperatures since the Industrial Revolution. Cutting methane emissions is one of the most effective near-term ways to limit global warming and improve air quality. Today, the energy sector accounts for around 40% of total methane emissions attributable to human activity, second only to agriculture. In 2022, the global energy industry released nearly 135 million tonnes of methane into the atmosphere, only slightly below the record highs seen in 2019. However, emissions from very large leaks detected by satellite fell by almost 10% in 2022 from what was detected in 2021, and preliminary estimates indicate that there was also a reduction in natural gas flaring.
CCUS set to expand rapidly if all planned projects come online
The IEA's Carbon Capture, Utilisation and Storage (CCUS) database tracks all CO2 capture, transport, storage, and utilisation projects that have been commissioned since the 1970s and includes projects under construction and planned. If all projects in the pipeline come to fruition, global CO2 capture capacity would reach over 300 million tonnes per year by 2030.
Half the emission reductions needed to reach net zero come from technologies not yet on the market
Clean energy employs over 50% of total energy workers
The energy sector employed over 65 million people in 2019, equivalent to around 2% of global employment. Energy sector employment recovered strongly after the Covid-19 pandemic, returning to pre-pandemic levels by 2021 thanks to resilient growth in clean energy and recently introduced incentives. Clean energy employs over 50% of total energy workers, owing to the substantial growth of new projects coming online—a trend seen across most global regions.- ABB
- General Electric
- EMERSON
- Honeywell
- HIMA
- ALSTOM
- Rolls-Royce
- MOTOROLA
- Rockwell
- Siemens
- Woodward
- YOKOGAWA
- FOXBORO
- KOLLMORGEN
- MOOG
- KB
- YAMAHA
- BENDER
- TEKTRONIX
- Westinghouse
- AMAT
- AB
- XYCOM
- Yaskawa
- B&R
- Schneider
- Kongsberg
- NI
- WATLOW
- ProSoft
- SEW
- ADVANCED
- Reliance
- TRICONEX
- METSO
- MAN
- Advantest
- STUDER
- KONGSBERG
- DANAHER MOTION
- Bently
- Galil
- EATON
- MOLEX
- DEIF
- B&W
- ZYGO
- Aerotech
- DANFOSS
- Beijer
- Moxa
- Rexroth
- Johnson
- WAGO
- TOSHIBA
- BMCM
- SMC
- HITACHI
- HIRSCHMANN
- Application field
- XP POWER
- CTI
- TRICON
- STOBER
- Thinklogical
- Horner Automation
- Meggitt
- Fanuc
- Baldor
- SHINKAWA
- Other Brands


