
Tektronix XYZs of Oscilloscopes
Specialized probes for current, high voltage, optical probes, etc., converting non electrical signals into electrical signals requires matching the measurement scenario (such as high voltage probes for measuring voltage signals)
(2) Probe accessories and selection
Intelligent interface: Automatically identify probe attenuation (such as 10X) and type, adjust oscilloscope display.
Grounding lead adapter: Shortens the grounding distance from the probe tip to the DUT, improving high-speed signal integrity.
Selection principle: Probe+oscilloscope bandwidth ≥ signal maximum frequency × 5, minimize load (resistance/capacitance/inductance).
Performance Terms and Considerations
(1) Core performance parameters
Parameter definition and key data calculation formula/rule
The bandwidth sine signal attenuates to a frequency of 70.7% (-3dB), which determines the high-frequency response of the signal by 5 times. The rule is: oscilloscope bandwidth ≥ signal highest frequency component × 5
The rise time of the signal from 10% to 90% amplitude reflects the ability to capture rapid changes by 1/5 rule: oscilloscope rise time ≤ fastest rise time of the signal × 1/5; Rise time=k/bandwidth (k=0.35-0.45, 0.35 for<1GHz, 0.40-0.45 for>1GHz)
Sampling rate per second (S/s) determines real-time sampling of waveform details: sinx/x interpolation must be ≥ 2.5 times the highest frequency of the signal; Linear interpolation requires ≥ 10 times the highest frequency of the signal
The waveform capture rate is the number of waveforms captured per second (wfms/s), which determines the transient event capture probability DPO: in the millions per second; DSO: Level 10-5000 per second
Record the number of sampling points for a single waveform to determine the data volume. Time interval=record length/sampling rate, for example: 100k point record length, 1GS/s sampling rate, time interval=100 μ s
The effective number of bits measures the accuracy of ADC reconstruction of sine waves, and the signal frequency and amplitude need to be specified for noise and distortion effects
The ability of a vertical amplifier to amplify weak signals with vertical sensitivity, measured in mV/partition. The minimum voltage for a general-purpose oscilloscope is approximately 1mV/partition
The accuracy of timing displayed by the time base precision level system is usually a percentage error (such as ± 0.01%)
(2) Other considerations
Scalability: Supports increasing memory, application modules (such as jitter analysis, video testing), and third-party software (MATLAB).
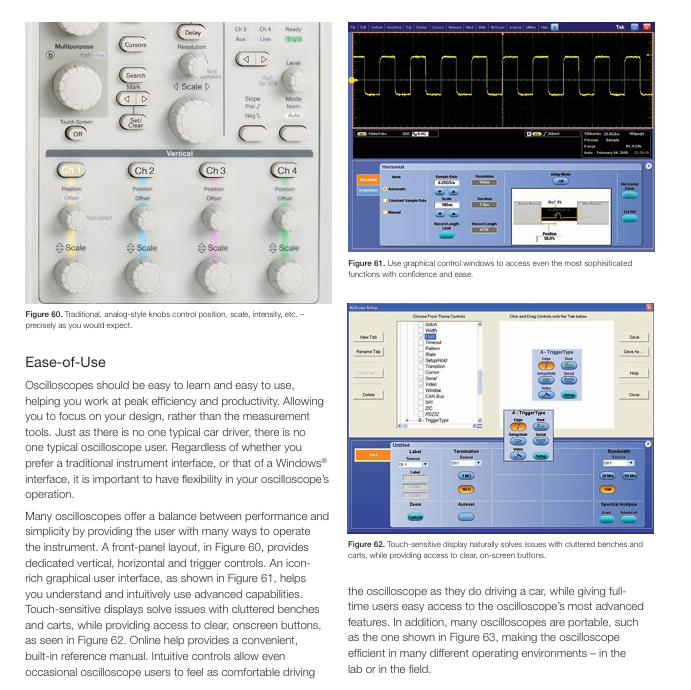
Usability: Front panel partition (vertical/horizontal/triggered), graphical interface, touch screen, portability (suitable for laboratory/field).
Oscilloscope Operation&Measurement Techniques
(1) Operation steps
Correct grounding:
Oscilloscope: 3-pin power plug grounded to prevent electric shock and ensure measurement reference.
Personnel: Wear a grounding wristband when in contact with IC to prevent static damage (IC conductive path is fragile).
Control settings:
Vertical: Select the channel, center the voltage/grid and position, couple with DC, and turn off the variable gain.
Horizontal: seconds/grid and centered position, record length can be selected as needed.
Trigger: Set the mode to automatic, select the current channel as the source, center the trigger level, and set the minimum suppression.
Calibration: If the ambient temperature changes by more than 5 ℃ or once a week, perform "signal path compensation" (refer to oscilloscope manual).
Probe connection and compensation:
Connection: Connect the probe tip to the test point and the grounding clip to the DUT ground (such as metal chassis).
Compensation: Connect the probe to the oscilloscope square wave reference signal and adjust the probe to make the square wave edge straight (to avoid measurement errors caused by under/over compensation).
(2) Measurement technology
Voltage measurement:
Adjust the voltage/grid to make the signal occupy 80% of the vertical partition (improve accuracy).
Number signal vertical span (number of partitions), voltage=number of partitions x volts/grid x probe attenuation ratio (e.g. 10X).
Example: 2V/div, signal occupying 4 zones, 10X probe, voltage=4 × 2V × 10=80V (peak to peak).
Time and frequency measurement:
Adjust the seconds/grids to ensure that the signal cycle occupies the full horizontal partition.
The horizontal span of the signal period (number of partitions), period=number of partitions x seconds/grid; Frequency=1/cycle.
Example: 1ms/div, period occupies 5 partitions, period=5 × 1ms=5ms, frequency=1/5ms=200Hz.
Pulse width and rise time measurement:
Pulse width: Measure the horizontal span at 50% amplitude of the signal, multiplied by seconds per grid.
Rise time: Measure the horizontal span at 10% -90% amplitude of the signal, multiplied by seconds per grid.
Phase difference measurement:
Turn on XY mode, CH1 is connected to signal 1 (Y-axis), CH2 is connected to signal 2 (X-axis), forming a Lissajous pattern.
Determine the phase difference based on the shape of the graph (e.g. 1:1 frequency ratio, 0 ° for straight lines, 90 ° for circles).
- OMRON
- ABB
- General Electric
- EMERSON
- Honeywell
- HIMA
- ALSTOM
- Rolls-Royce
- MOTOROLA
- Rockwell
- Siemens
- Woodward
- YOKOGAWA
- FOXBORO
- KOLLMORGEN
- MOOG
- KB
- YAMAHA
- BENDER
- TEKTRONIX
- Westinghouse
- AMAT
- AB
- XYCOM
- Yaskawa
- B&R
- Schneider
- KONGSBERG
- NI
- WATLOW
- ProSoft
- SEW
- ADVANCED
- Reliance
- TRICONEX
- METSO
- MAN
- Advantest
- STUDER
- DANAHER MOTION
- Bently
- Galil
- EATON
- MOLEX
- DEIF
- B&W
- ZYGO
- Aerotech
- DANFOSS
- Beijer
- Moxa
- Rexroth
- Johnson
- WAGO
- TOSHIBA
- BMCM
- SMC
- HITACHI
- HIRSCHMANN
- Application field
- XP POWER
- CTI
- TRICON
- STOBER
- Thinklogical
- Horner Automation
- Meggitt
- Fanuc
- Baldor
- SHINKAWA
- Other Brands
- UniOP
- KUKA
- Iba
- Beckhoff
- ADLINK
-
 Beckwith M-4272-6AB1EH0 Integrated Synchronizing Motor Bus Transfer
 -
Beckwith Electric M-4272 Motor Bus Transfer 60-140V 50/60Hz
-
 Beckwith Electric M-2001B TapChanger Control
 -
 Beckwith Electric M-0193B Synchrocloser Unit
 -
 Beckwith Electric M-0115A AC Parallel Balancing Module
 -
 Beckwith Electric M-0169A Current Transformer
 -
 Beckwith Electric P-1939 Generator Protection Annunciator Panel
 -
 Beckwith Electric M-3311A Transformer Protection Relay Guide
 -
 Beckwith Electric M-0245B High Speed Sync-Check Relay
 -
 Beckwith Electric M3420 Generator Protection Relay
 -
 Beckwith M-0193B Syncrocloser Unit
 -
 Beckwith Electric M-520 Intertie Protection Relay
 -
 Beckwith Electric M-3425A Generator Protection Relay
 -
 Beckwith M-3425 Integrated Generator Protection Relay
 -
Beckwith M-0115A Parallel Balancing Module
-
Beckwith Electric M-4272 Integrated Synchronizing Motor Bus Transfer
-
Beckwith Electric M-3420 Generator Protection System
-
Beckwith M-0193 Syncrocloser Unit
-
 Basler Electric DECS-250-CN1SN1N Digital Excitation Control System
 -
 Basler Electric BE1-700 E0N2X1N Digital Protective Relay
 -
 Basler Electric SR4A-2B15B3A Static Voltage Regulator 120VAC 50/60Hz
 -
 Basler Electric 9261402111 PCB Control Board 9346000033
 -
 Basler Electric BE28053-002 Transformer BE28053002
 -
 Basler Electric BE3-25A Auto Synchronizer B1D Sync Module
 -
 Basler Electric BE3-GPR Generator Protective Relay
 -
 Basler Electric SCP-250-G-60 VAR Power Factor Controller 9 1100 00 109
 -
 Basler Electric BE3-32-1S1N1 Reverse Power Relay 277V 5A
 -
 Basler Electric ACA1300-60GM Area Scan Camera 106200-17
 -
 Basler Electric UFOV 260 A Protection Module Specs
 -
 Basler Electric BE03303001 Control Module
 -
Basler Electric BE3-GPR-P1BVSF Generator Protective Relay
-
 Basler Electric BE1-87G Solid State Protective Relay Guide
 -
 BASLER ELECTRIC BE1-60 VOLTAGE BALANCE RELAY T176884
 -
 Basler Electric BE1-32R Protective Relay
 -
 Basler Electric 9022900-103 Transformer 6-7VA 60Hz
 -
 Basler Electric BE1-59-A4E-E1K-B1S3F Overvoltage Relay
 -
 Basler Electric KR2FF-M Voltage Regulator 9 1163 00 103
 -
 Basler Electric UFOV 260 A Protective Module
 -
 Basler Electric PCB Assembly 9059701100 919620
 -
 Basler Electric SR8A2B01A3E Static Voltage Regulator
 -
 Basler Electric SSR125-12 Static Voltage Regulator 9185900102
 -
 Basler Electric SSR 63-12 Static Voltage Regulator 600VAC
 -
 Basler Electric BE1-60 Solid State Protective Relay
 -
 Basler Electric BE3-47N/27-3A4N2 Voltage Relay 9320400101
 -
 Basler Electric BE1-59 Over Voltage Relay
 -
 Basler Electric DECS100-B15 Automatic Voltage Regulator
 -
 Basler Electric PRS250 Veri-Sync Relay 9088800102
 -
Basler Electric BE25927001 Current Transformer 1:34 Amp
-
Basler Electric 9170818100 Generator Differential Relay
-
 Basler Electric BE1-59N Solid State Ground Fault Overvoltage Relay
 -
 Basler Electric 1783 DC Current Transformer Coil 1200:5A
 -
Basler Electric BE1-67 Ground Directional Overcurrent Relay
-
 Basler Electric UFOV-260A Underfrequency Overvoltage Module
 -
 Basler Electric BE10493001 Control Module
 -
Basler Electric SSR125-12 Static Voltage Regulator Guide
-
 Basler Electric BE1810/U-2 Solid State Frequency Relay Guide
 -
 Basler Electric 9105100106 UFOV-250A Protector Guide
 -
 Basler Electric MOC2199 9072300-335 Relay Module Guide
 -
 Basler Electric 9289902106 Circuit Board
 -
Basler Electric BE1-32R Protective Relay A1E E1P BOS1P
-
 Basler Electric RAL6144-16GM GigE Line Scan Camera with Lens
 -
 Basler Electric BE3-49R-5I5A1 Temperature Relay
 -
 Basler Electric BE1-32R Power Relay B3E E1R A0N1F
 -
 Basler Electric SR4A2B06B3A Static Voltage Regulator Features
 -
 Basler Electric 9121000106 Manual Voltage Control MVC Guide
 -
Basler Electric SR32A-2B15B3E Static Voltage Regulator
-
 Basler Electric SR4A2B06B3A Static Voltage Regulator Guide
 -
Basler Electric 801A193F02 Hammond Transformer Module
-
 Basler Electric BE1-24 Volts Per Hertz Relay A1E F1J D1S0F
 -
 Basler Electric AEC63-7 Analog Excitation Controller 220-277V
 -
Basler Electric BE132R Power Relay T245579
-
 Basler Electric MVC 108 Manual Voltage Control 90 37000 102
 -
 Basler Electric 9022900-103 Control Transformer 6-7VA 60Hz
 -
 Basler Electric BE1-79M Plug Adapter 9170111102
 -
 Basler Electric 9 2007 00 100 Current Boost System CBS 305
 -
 Basler Electric SR4A2B01B3A Static Voltage Regulator 120V
 -
Basler Electric BE1-32R Power Solid State Relay E2E A10 A0N0F
-
Basler Electric PRS250 Veri-Sync Relay 9088800102
-
 Basler DECS 125-15-B2C Digital Excitation Control
 -
 Basler BE 13693 002 Transformer
 -
Basler BE1-59N Ground Fault Overvoltage Relay
-
 Basler BE1-79A Reclosing Relay
 -
Basler 9-1051-00-105 Overload Protection Module
-
 Basler BE1-32R Power Relay – Directional Overcurrent Guide
 -
 Basler 9319700103 BE3-27T/59T-3A1N3 Voltage Relay
 -
Basler BE1-87G Generator Differential Relay
-
 Basler BE3-25-1D1N4 9319100106 480V Relay
 -
 Basler SR8A2B07B3A Static Voltage Regulator
 -
 Basler Electric BE4-27/59 Over/Under Voltage Relay 307-2552
 -
Basler Electric SR32A2B05B3E Static Voltage Regulator
-
Basler Electric BE1-27 A3E C3J A1N6F Solid State Protective Relay
-
 Basler Electric 9174700-100 Excitation Limiter Generator
 -
Basler Electric BE1-87G Generator Differential Relay 09833
-
 Basler Electric 9310200100 Power Supply Module
 -
 Basler Electric TIEE1CD0N07 Control Module
 -
Basler Electric BE1-59N Ground Fault Relay T214750
-
Basler Electric SR8A2B10B3AX Static Voltage Regulator 9060200126
-
 Basler Electric SSR 125-12 Voltage Regulator
 -
 Rolls Royce H1111.0204 Ship Main Controller
 -
 Basler Electric BE3-32-3AC Reverse Power Relay 9 1376 00 105
 -
Basler Electric BE3-25-1A1N4 Synch Check Relay 9319100100
-
 Basler Electric SR4A-2B15B3A Static Voltage Regulator
 -
 Basler Electric SR4A-2B15B3E Static Voltage Regulator
 -
 Basler Electric 9170818100 Solid State Protective Relay
 -
 Basler Electric AEC63-7 Analog Excitation Controller
 -
Basler Electric 17483 Auxiliary Module
-
Basler Electric BE1-59 Over Voltage Relay
-
Basler Electric 21600-101 Control Module
-
 Basler Electric KR2F Generator Voltage Regulator 9056600100
 -
Basler BE1-CDS Current Differential System
-
 Basler Electric CBS 212 Current Boost System 9 2650 00 100
 -
 Basler Electric IFM-150 Firing Circuit Chassis
 -
 Basler Electric BE1-60 Voltage Balance Relay C1F A1P D0C3F
 -
Basler Electric BE1-32R Power Relay A2E D1R A0N0F
-
Basler Electric BE1-32R Power Relay A2E D1R A0N0F
-
 Basler Electric 8650C80G01 Isolation Transducer PCB Board
 -
 ETEL EA-P2M-300-4/7.5A-0100-01 AccurET Modular 300 Servo Drive
 -
Basler Electric 87T Transformer Differential Relay
-
Basler Electric BE-6868 Power Transformer 5950007559202
-
 Basler Electric PRS250 Veri-Sync Relay 9088800102
 -
 Basler Electric SCP-250-G-60 VAR Power Factor Controller
 -
 Basler DECS-150 AVR 1NS2V1N1S Voltage Regulator
 -
Basler UFOV 260A Under Frequency Overvoltage Module
-
 Basler MOC2 199 Motor Operated Control – Overview and Setup
 -
 Basler BE3-49R-5K5A1 Temperature Relay – Complete Guide
 -
Basler BE 20035 001 Transformer – Technical Data and Installation
-
Basler BE 02727 001 Transformer – Specifications and Usage
-
 Basler BE127 Under Voltage Relay – Features and Application Guide


